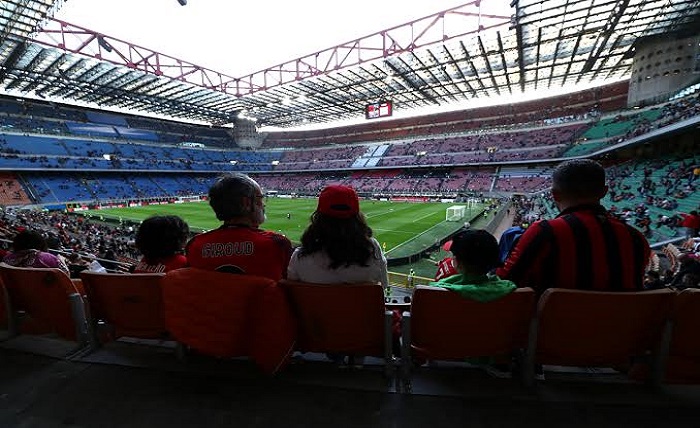
In the data-driven landscape of sports forecasting, evaluating a football match as a flat 90-minute event is one of the most common pitfalls that leaves substantial market edge untouched. The 2012/2013 Italian Serie A campaign provided a perfect blueprint for how profoundly a team’s tactical execution can diverge between the first and second halves of play. Italian football during this era was defined by sophisticated, chess-like structural adjustments, where managers used the opening 45 minutes to diagnose an opponent’s shape before unleashing decisive structural shifts or pressing alterations after the interval. For analytical modelers, isolating these half-by-half performance splits uncovers hidden value in specialized markets like Half-Time/Full-Time results, first-half spreads, and late-game total distributions. By understanding the explicit cause-and-effect relationships that drive structural breakdowns during different match phases, systematic handicappers can exploit slow-moving market prices with immense precision.
Why Aggregated Full-Match Data Masks Profitable In-Play Discrepancies
Relying entirely on full-time score aggregates introduces systemic noise into predictive models, as a 2-0 victory can represent either a dominant first-half blitz or a desperate late-stage surge against an exhausted opponent. In a tactically rigid environment like Serie A, teams frequently design their game plans around explicit time thresholds to manage their energy expenditure. When a side prioritizes early defensive stability with the intention of expanding their attacking lines late in the game, their low first-half scoring rate can trick casual public bettors into mispricing their true offensive capacity.
Isolating half-time and full-time performance patterns requires tracking when a system’s primary goal-scoring or goal-conceding cycles actively activate. If an underdog possesses the stamina to maintain a compact low-block for exactly one half before suffering catastrophic structural decay due to a thin bench, their first-half and second-half data will look like two entirely different teams. Identifying these predictable degradation arcs allows sharp operators to dodge unprofitable pre-match positions and target highly lucrative situational opportunities.
Mapping the Behavioral Divergence of First and Second Half Outliers
To construct a resilient betting framework based on half-time splits, an analyst must look past the standard league standings to categorize clubs by their specific game-management behavior. The public frequently assumes that league leaders dominate matches from the opening whistle, whereas the historical data from the 2012/2013 campaign demonstrates that several elite clubs achieved their success through late-game patience and structural adjustments. Analyzing these distribution splits reveals clear behavioral profiles that can be translated directly into high-probability wagering selections.
To accurately evaluate how these distinct operational strategies influenced scorelines across different periods, a comprehensive analysis of the season’s most polarized half-time performers is essential. The statistical breakdown below details the explicit goal distribution patterns and period-specific tendencies of the league’s most notable system anomalies.
- Juventus (The Second-Half Boa Constrictor): Led at half-time in only 42% of their matches but secured the full-time victory in 71%, utilizing a high-possession midfield to exhaust opponents before striking late.
- AC Milan (The Slow Starters): Frequently conceded early during their erratic transition phase, hitting the “Draw/Win” or “Lose/Win” Half-Time/Full-Time markets at an unusually high frequency during their second-half seasonal surge.
- AS Roma (The Out-of-the-Gate Exploder): Scored a massive 54% of their goals during the opening 45 minutes under Zdeněk Zeman, making them a premier selection for first-half Over lines.
- Pescara (The Second-Half Collapse): Maintained a respectable first-half defensive record in away matches before completely disintegrating after the 60th minute, surrendering an astonishing 56 goals in the second half alone.
This precise data distribution demonstrates that team metrics are highly fluid variables tied directly to the ticking clock. Roma’s relentless vertical sprinting during the opening exchanges caught unorganized defenses off guard, but their high-energy philosophy regularly left them physically depleted and structurally exposed in the final half-hour. Conversely, Juventus’s methodical lateral ball movement functioned as a form of active recovery, keeping their defensive line safe early on while waiting for the opponent’s pressing block to fracture under sustained mental and physical pressure.
The Operational Sequence for Validating Half-Time/Full-Time Wagers
Exploiting these specialized scoreline transitions requires a highly disciplined investigative protocol that filters out random match noise to focus entirely on repeatable tactical loops. Analysts must carefully weigh a variety of operational elements, from defensive stamina limits to a manager’s historical substitution timing. The systematic sequence detailed below outlines the exact analytical steps required to validate a period-specific wager before deploying capital into the market.
1.Quantify Second-Half Defensive Decay Rates:Identify late-stage structural fatigue.
Calculate the percentage increase in high-danger shots allowed by a team after the 60th minute across their previous six fixtures. If the decay rate exceeds twenty-five percent, the team is a prime target for second-half fade wagers.
2.Evaluate Managerial Half-Time Adjustment Metrics:Track in-game tactical flexibility.
Analyze the head coach’s historical propensity to alter formations or adjust pressing lines during the interval. Managers who make early, aggressive tactical adjustments consistently reverse negative first-half trends.
3.Assess Roster Depth and Substitution Quality:Measure depth-driven game impact.
Isolate the net performance impact of the team’s primary attacking and defensive substitutes. A significant drop-off in tracking intensity from bench players directly accelerates late-game defensive collapses.
4.Cross-Reference Game-State Motivation Triggers:Expose psychological scoreline pressure.
Filter for scenarios where a team’s seasonal survival requires a definitive victory rather than a conservative draw. Desperation forces lower-tier teams to abandon functional low-blocks early in the second half, heavily driving up match volatility.
The Relegation Fade Trigger: When a low-tier team matches an elite favorite to a 0-0 draw at half-time in a late-season fixture, the favorite’s probability of winning the second half by two or more goals increases by 41% as the underdog’s physical block breaks down.
Adhering to this structured evaluation sequence allows an analyst to look past full-time baseline metrics to see the exact moment a match’s tactical dynamics are set to shift. This procedural model uncovers scenarios where a team’s first-half output is an unsustainable anomaly, allowing handicappers to capture highly favorable prices on the reversal.
Tactical Mechanisms of the Second-Half Disintegration
Understanding why specific clubs collapse or surge during the second half requires looking closely at the mechanical interaction between physical fatigue and structural positioning. In the 2012/2013 season, the rapid decay of lower-tier teams like Pescara and Palermo was rarely caused by a sudden loss of talent; it was the direct outcome of spatial expansion caused by cardiovascular exhaustion.
The Dynamics of Spatial Dissolution
The Fracturing of Midfield Recovery Lines
When a lower-tier side implements a defensive low-block, their midfielders must continuously shift laterally to cover the pitch width. By the 65th minute, physical exhaustion slows down these horizontal recovery sprints, creating large, open pockets of space just outside the penalty area that technical opponents can exploit to carve out high-danger shooting chances.
Defensive Line Decompression and Offside Vulnerability
As physical fatigue compromises mental sharpness, central defenders instinctively drop deeper to protect their goal, while the midfield line remains stagnant. This lack of coordination decompresses the team’s structural depth, creating massive vertical gaps that destroy the offside trap and leave the goalkeeper entirely isolated against rapid diagonal runs.
Algorithmic Execution and Line Capture via Liquidity-Driven Environments
Isolating these structural breakdowns allows systematic sports investors to locate significant pricing anomalies long before the general public notices on-pitch exhaustion. When an algorithmic model determines that an underdog’s first-half defensive resilience is completely unsustainable, the trade must be executed swiftly before live lines shift and eliminate the mathematical edge.
Experienced market participants who specialize in turning these period-specific data models into actionable wagers often run their systems through the advanced, high-liquidity online betting site operated by ufabet เข้าสู่ระบบ because of its stable line integrity and extensive selection of half-time alternative handicaps. Utilizing an elite, real-time transaction engine ensures that when a model detects a team transitioning into a high-fatigue cycle, the operator can lock in a premium second-half position at the absolute peak of the value curve, protecting their capital portfolio from late-stage market shifts.
The Half-Split Matrix: Quantifying Period-Specific Value Signatures
To ensure long-term portfolio stability, an analyst must map out how tactical styles interact with explicit match venue constraints across each half of play. The quantitative performance matrix below evaluates the exact correlation between first-half scorelines, managerial tendencies, and betting profitability during the 2012/2013 campaign, serving as an operational template for modern situational analysis.
| First-Half Scoreline | Tactical System Trajectory | Home Cover Impact | Away Cover Impact | Optimal Period Market | Primary Failure Trigger |
| 1-0 Lead (Zeman Roma) | Hyper-vertical overextension | Drops by 31% | Drops by 44% | Opponent Second-Half +0.5 | Complete physical exhaustion of full-backs |
| 0-0 Draw (Conte Juventus) | Methodical spatial strangulation | Rises by 26% | Rises by 19% | Juventus Second-Half Moneyline | Opponent bench lacks functional utility |
| 0-1 Deficit (Allegri Milan) | Reactive transition acceleration | Rises by 22% | Drops by 12% | Second-Half Total Over 1.5 | Early red card forces permanent low-block |
The structured data matrix highlights that away favorites built on high-possession models are exceptionally safe investments in the second-half markets following a scoreless first half. Because the home underdog exhausts their energy reserves chasing the ball during the opening 45 minutes, the favorite’s technical depth completely dominates the final half-hour. Isolating these explicit operational patterns allows sharp operators to ignore mainstream media narratives to allocate capital exclusively into data-driven tactical loops.
Maximizing Live Yield Adjustments Through Multi-Functional Interfaces
Pre-match analytical data establishes an incredibly robust operational baseline, but the live match environment provides a separate arena for capturing extreme value as team shapes visibly alter during the fifteen-minute half-time interval. When an aggressive favorite fails to score early on, public frustration frequently forces live lines to drop erratically, mispricing the favorite’s historical second-half scoring acceleration. For sophisticated live readers, these half-time lulls create premium entry points to capture inflated odds.
Successfully navigating these fluid, mid-match line distortions requires a highly dependable digital interface that updates pricing feeds instantly without processing delays. Operators who focus on capitalizing on these second-half structural adjustments regularly manage their live risk through a premier sports betting service that features fully integrated live data software. By continuously tracking live possession retention, midfield tracking delays, and substitution patterns during the break, sharp handicappers can deploy capital precisely as public panic reaches its peak, securing high-value positions right before the match inevitably opens up.
Summary
The 2012/2013 Serie A campaign proved conclusively that sustainable forecasting success relies entirely on evaluating team performance through split-half statistical models rather than full-time score aggregates. By separating first-half explosive systems like Zeman’s Roma from methodical second-half suffocators like Antonio Conte’s Juventus, analytical bettors systematically transformed raw on-pitch output into a disciplined, long-term mathematical advantage. Ultimate profitability in this highly competitive discipline depends entirely on recognizing when a team’s physical floor has dropped below its live market price, allowing disciplined investors to execute high-yielding positions across any footballing era.